-
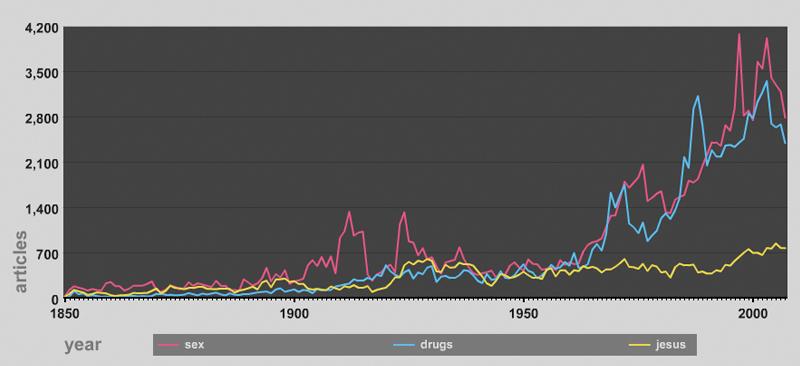
New York Times Data Grapher
Click here to go to the Data Graphing Interface Last year I wrote a data mining application that can automatically gather term usage data from the New York Times website. I used this data for a number of my projects including Geohistoriography and Command Center. I have just released a public version of the graphing interface […]
-
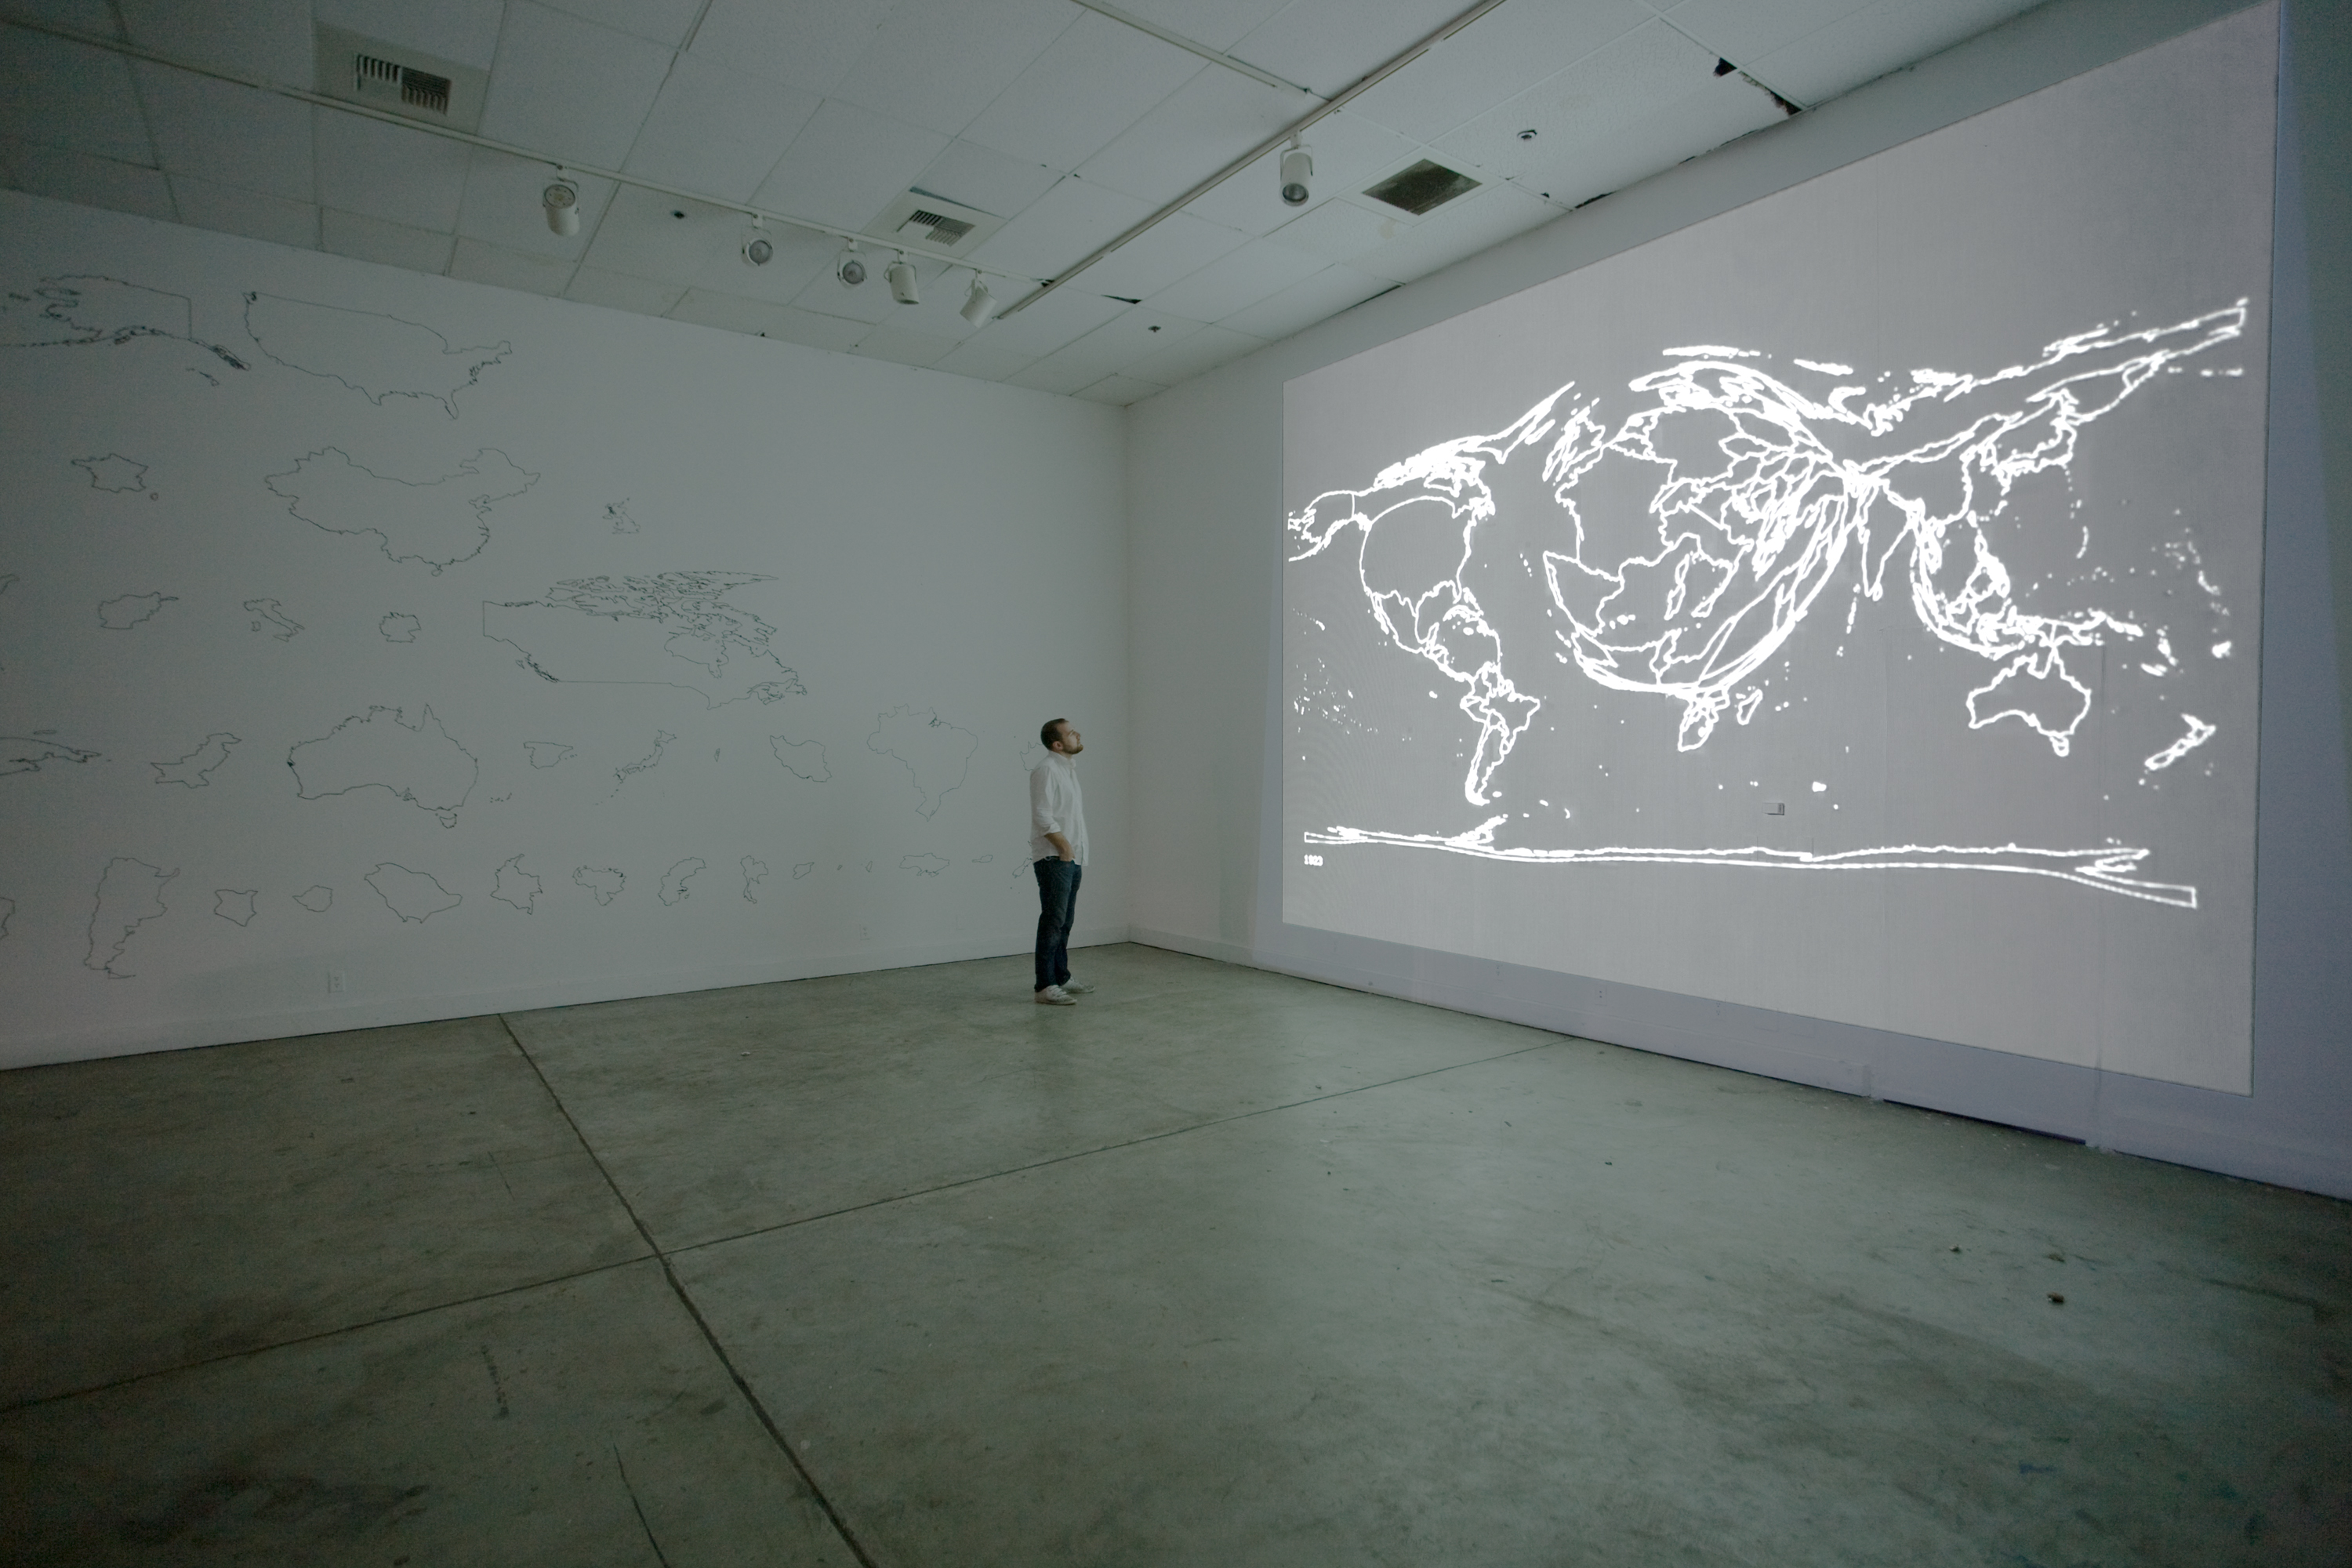
Geohistoriography
This show captures how America views the world as seen through the lens of the American media. All data was collected from the New York Times, namely the number of articles written about a certain country for each year. The two wall drawings are representations of the 2008 state of America’s view of the world. […]
-
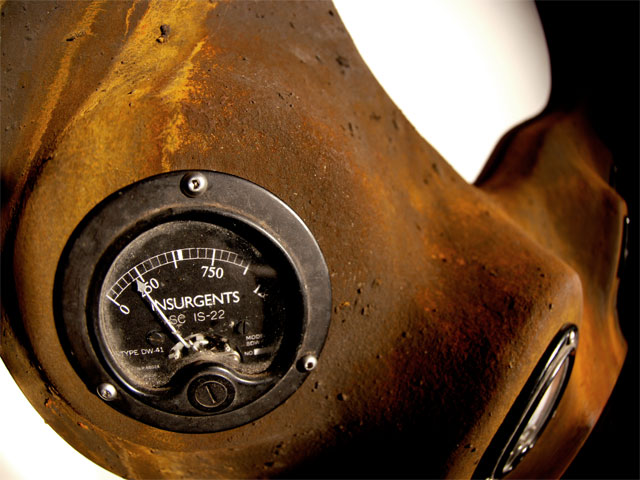
Command Center
Command Center replays the last 150 years of history, by showing the frequency of terms used in the New York Times. Over a four minute period, the four digit LED display counts the years from 1851 to 2008. At the same time the gauges move to their respective values, each of which represents the number […]
-
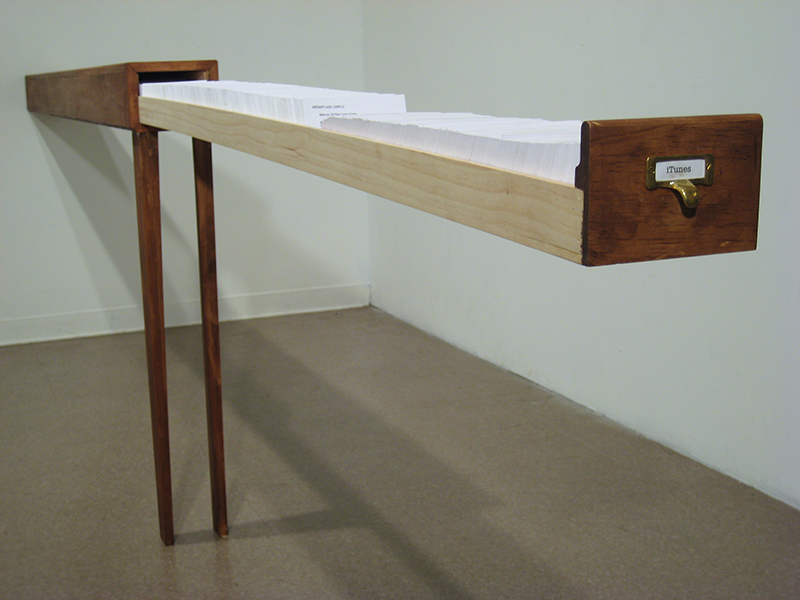
Card Catalog
A card catalog designed to hold all of the songs on my iPod, 7,390 songs. Each song is cataloged on a single card. The cards are organized in reverse chronological order, that is the songs I listened to most recently are in the front of the catalog, and the songs I haven’t listened to in […]
-
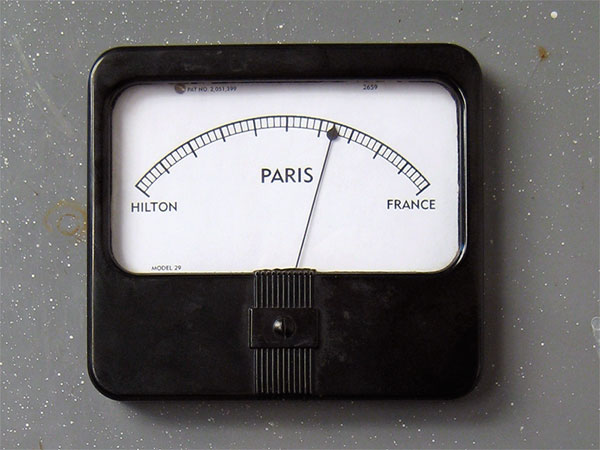
Paris
The piece is attached via a network cable to the internet where it monitors news and search results for “paris hilton” and “paris france” and displays an average result in real-time.
-
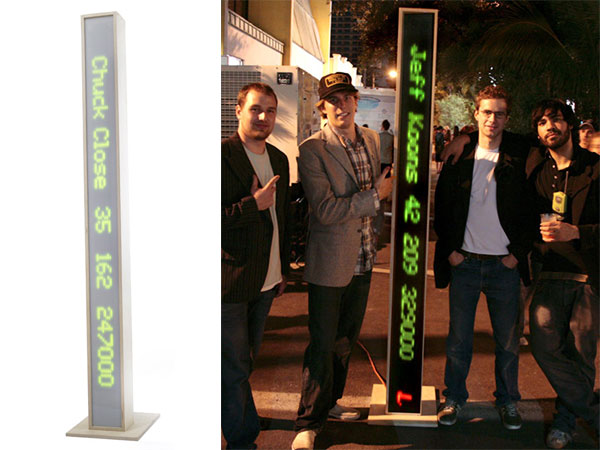
Art Ticker
A collaboration by Fame Theory. While looking through the data collected for famegame.com, we began to realize that some big name artists were turning up in the socialite database. Cross-referencing the artists showing at Art Basel Miami with the socialite database yielded 150 artist matches. Using the data already accrued on these artists, a LED […]
-
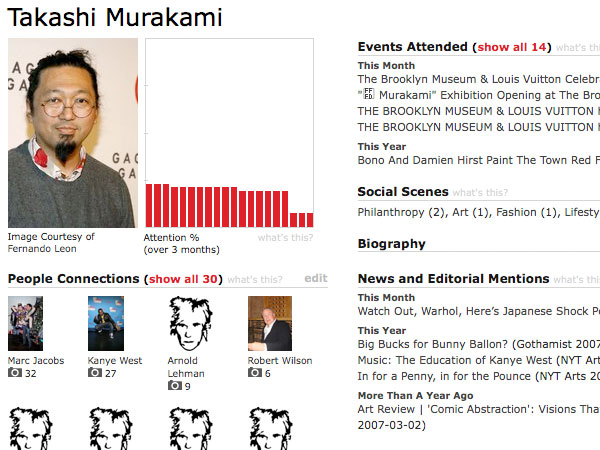
Fame Game
A collaboration with Fame Theory. Fame Game began as an investigation into the growth of celebrity in our media. By analyzing red-carpet events we came up with a map of the socialite/celebrity world consisting of 120,000 individuals and 6,000 organizations. We could intimately understand who scratched who’s back. This raw data eventually turned into a […]
-
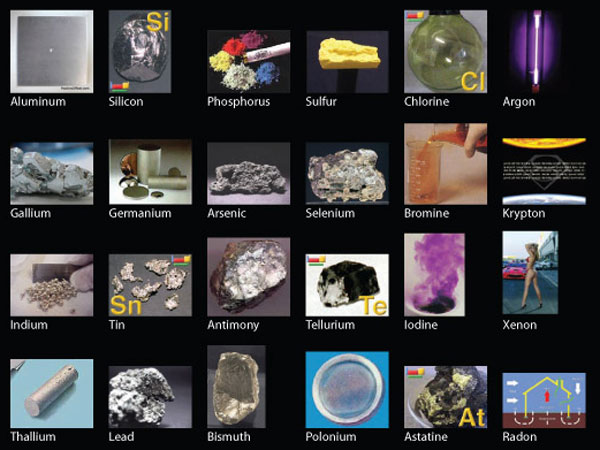
Google Image Periodic Table
I created a periodic table of elements by taking the first image returned by google when the name of an element was searched for. This piece creates a snapshot of what our culture associates with these particular words. For example, Platinum is associated with a hair color most often, Krypton with Superman, and Lithium with […]